
View options for Images#
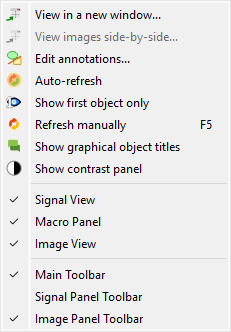
Screenshot of the “View” menu.#
When the “Image Panel” is selected, the menus and toolbars are updated to provide image-related actions.
The “View” menu allows you to visualize the current image or group of images. It also allows you to show/hide titles, to show/hide the contrast panel, to refresh the visualization, and so on.
View in a new window#
Open a new window to visualize the selected images.
This option allows you to show the selected images in a separate window, in which you can visualize the data more comfortably (e.g., by maximizing the window) as well as to add or edit annotations.
When you click on the button “Annotations” in the toolbar of the new window, the annotation editing mode is activated (see the section “Edit annotations” below).
View images side-by-side#
Open a new window to visualize the selected images side-by-side.
This option allows you to show the selected images in a separate window, arranged in a grid layout, with synchronized zooming and panning. This is useful to compare multiple images simultaneously.
Edit annotations#
Open a new window to edit annotations.
This option allows you to edit the annotations of the selected images in a separate window. This is equivalent to select the “View in a new window” option and then click on the “Annotations” button in the toolbar of the new window.
Annotations are used to add text, lines, rectangles, ellipses, and other geometrical shapes to the images. They are useful to highlight regions of interest, to add comments, to mark points, and so on.
Note
The annotations are saved in the metadata of the image, so they are persistent and will be displayed every time you visualize the image.
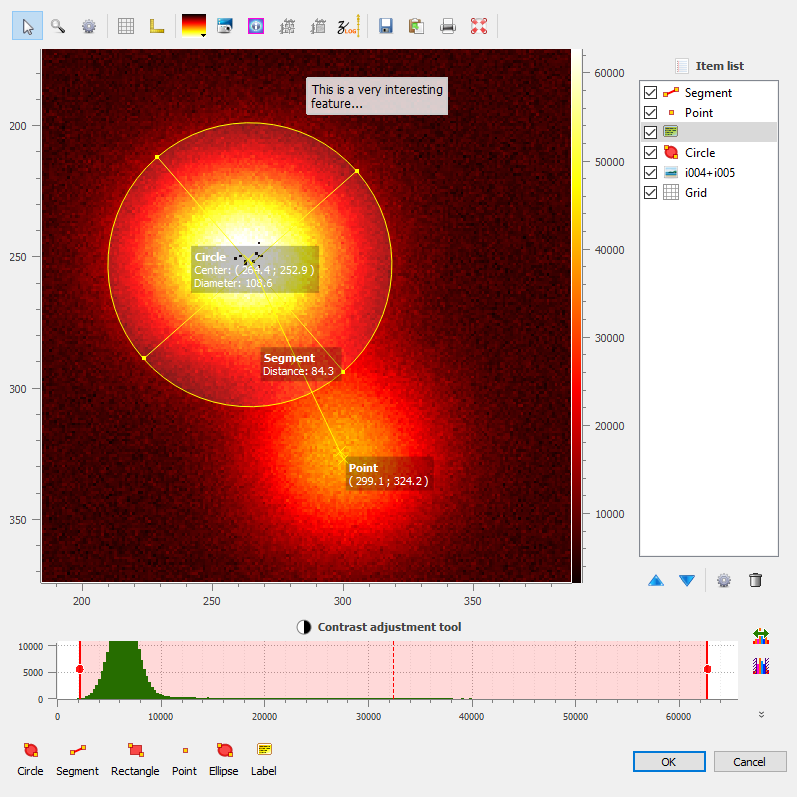
Annotations may be added in the separate view.#
The typical workflow to edit annotations is as follows:
Select the “Edit annotations” option.
In the new window, add annotations by clicking on the corresponding buttons at the bottom of the window.
Eventually, customize the annotations by changing their properties (e.g., the text, the color, the position, etc.) using the “Parameters” option in the context menu of the annotations.
When you are done, click on the “OK” button to save the annotations. This will close the window and the annotations will be saved in the metadata of the image and will be displayed in the main window.
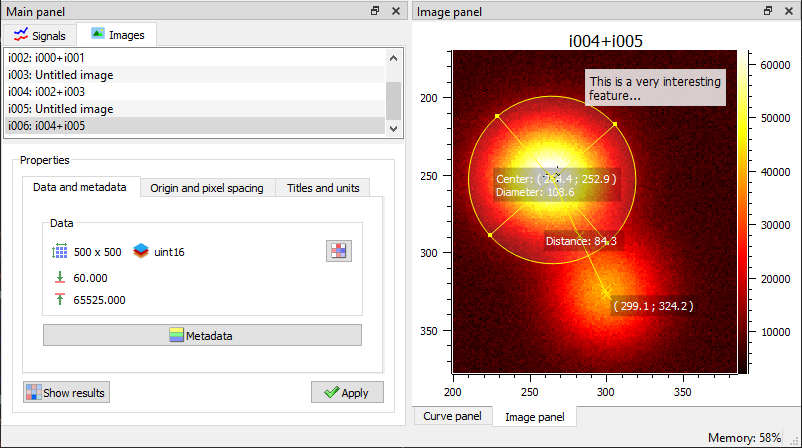
Annotations are now part of the image metadata.#
Note
Annotations may be copied from an image to another by using the “copy/paste metadata” features.
Auto-refresh#
Automatically refresh the visualization when the data changes:
When enabled (default), the plot view is automatically refreshed when the data changes.
When disabled, the plot view is not refreshed until you manually refresh it by using the “Refresh manually” menu entry.
Even though the refresh algorithm is optimized, it may still take some time to refresh the plot view when the data changes, especially when the data set is large. Therefore, you may want to disable the auto-refresh feature when you are working with large data sets, and enable it again when you are done. This will avoid unnecessary refreshes.
Show only first selected image#
Toggle between showing all selected images or only the first one.
When this option is enabled, only the first selected image is displayed in the plot view. This may be useful when multiple images are selected and focusing on a single image is (temporarily) preferred.
Refresh manually#
Refresh the visualization manually.
This triggers a refresh of the plot view. It is useful when the auto-refresh feature is disabled, or when you want to force a refresh of the plot view.
Show contrast panel#
Show/hide contrast adjustment panel.
Show graphical object titles#
Show/hide titles of analysis results or annotations.
This option allows you to show or hide the titles of the graphical objects (e.g., the titles of the analysis results or annotations). Hiding the titles can be useful when you want to visualize the data without any distractions, or if there are too many titles and they are overlapping.