
2D Peak Detection#
DataLab provides a “2D Peak Detection” feature which is based on a minimum-maximum filter algorithm.
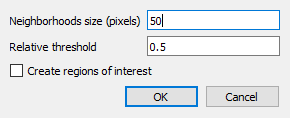
2D peak detection parameters.#
- How to use the feature:
Create or open an image in DataLab workspace
Select “2d peak detection” in “Analysis” menu
Enter parameters “Neighborhoods size” and “Relative threhold”
Optionally, enable “Create regions of interest” to automatically create ROIs around each detected peak:
Choose ROI geometry: “Rectangle” or “Circle”
ROI size is automatically calculated based on the minimum distance between detected peaks (to avoid overlap)
This feature requires at least 2 detected peaks
Created ROIs can be useful for subsequent processing on each peak area (e.g., contour detection, measurements, etc.)
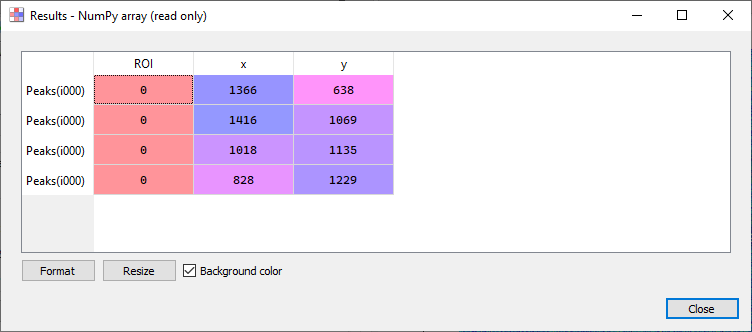
2d peak detection results (see test “peak2d_app.py”)#
- Results are shown in a table:
Each row is associated to a detected peak
First column shows the ROI index (0 if no ROI is defined on input image)
Second and third columns show peak coordinates
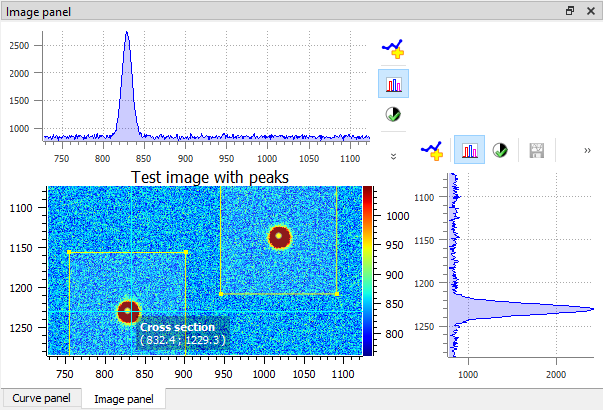
Example of 2D peak detection.#
- The 2d peak detection algorithm works in the following way:
First, the minimum and maximum filtered images are computed using a sliding window algorithm with a user-defined size (implementation based on scipy.ndimage.minimum_filter and scipy.ndimage.maximum_filter)
Then, the difference between the maximum and minimum filtered images is clipped at a user-defined threshold
Resulting image features are labeled using scipy.ndimage.label
Peak coordinates are then obtained from labels center
Duplicates are eventually removed
- The 2d peak detection parameters are the following:
“Neighborhoods size”: size of the sliding window (see above)
“Relative threshold”: detection threshold
“Create regions of interest”: if enabled, automatically creates ROIs around each detected peak (requires at least 2 peaks)
“ROI geometry”: shape of the ROIs (“Rectangle” or “Circle”)
Feature is based on get_2d_peaks_coords function from sigima.tools module:
@check_2d_array(non_constant=True)
def get_2d_peaks_coords(
    data: np.ndarray, size: int | None = None, level: float = 0.5
) -> np.ndarray:
    """Detect peaks in image data, return coordinates.

    If neighborhoods size is None, default value is the highest value
    between 50 pixels and the 1/40th of the smallest image dimension.

    Detection threshold level is relative to difference
    between data maximum and minimum values.

    Args:
        data: Input data
        size: Neighborhood size (default: None)
        level: Relative level (default: 0.5)

    Returns:
        Coordinates of peaks
    """
    if size is None:
        size = max(min(data.shape) // 40, 50)
    data_max = spi.maximum_filter(data, size)
    data_min = spi.minimum_filter(data, size)
    data_diff = data_max - data_min
    diff = (data_max - data_min) > get_absolute_level(data_diff, level)
    maxima = data == data_max
    maxima[diff == 0] = 0
    labeled, _num_objects = spi.label(maxima)
    slices = spi.find_objects(labeled)
    coords = []
    for dy, dx in slices:
        x_center = int(0.5 * (dx.start + dx.stop - 1))
        y_center = int(0.5 * (dy.start + dy.stop - 1))
        coords.append((x_center, y_center))
    if len(coords) > 1:
        # Eventually removing duplicates
        dist = distance_matrix(coords)
        for index in reversed(np.unique(np.where((dist < size) & (dist > 0))[1])):
            coords.pop(index)
    return np.array(coords)