


Key features#
This page presents briefly DataLab key features.
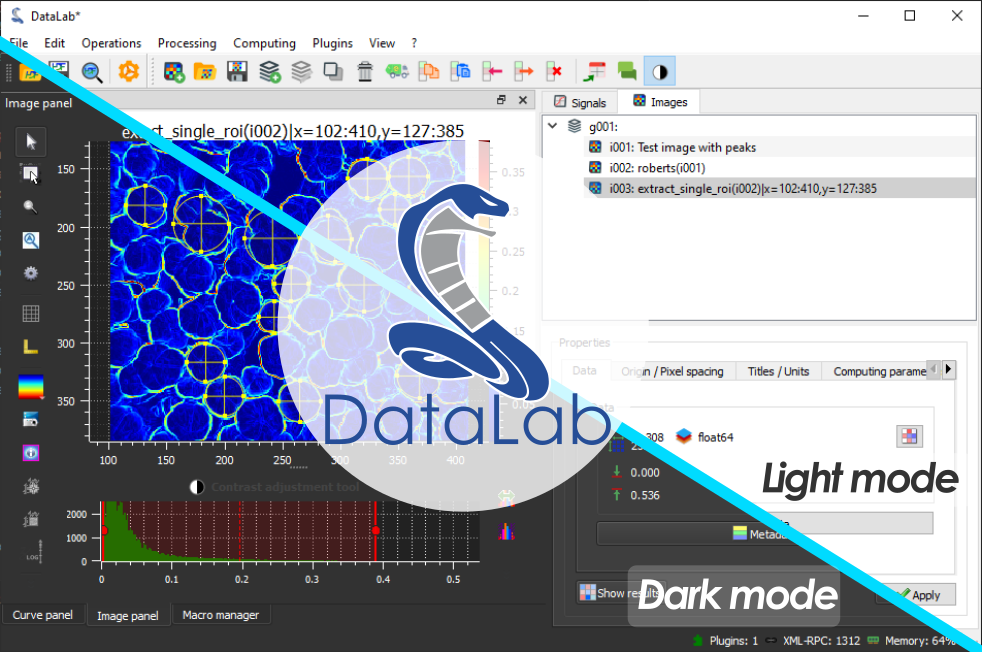
DataLab supports dark and light mode. The color mode may be chosen in the “General” tab of the Settings: by default (“auto” mode), it follows your platform settings (this is handled by the guidata package, and may be overridden by setting the QT_COLOR_MODE environment variable to dark or light).#
Data visualization#
Signal |
Image |
Feature |
|---|---|---|
✓ |
✓ |
Screenshots (save, copy) |
✓ |
Z-axis |
Lin/log scales |
✓ |
✓ |
Data table editing |
✓ |
✓ |
Statistics on user-defined ROI |
✓ |
✓ |
Markers |
✓ |
Aspect ratio (1:1, custom) |
|
✓ |
50+ available colormaps (customizable) |
|
✓ |
Intensity profiles (line, average, radial) |
|
✓ |
✓ |
Annotations |
✓ |
✓ |
Persistence of settings in workspace |
✓ |
Distribute images on a grid |
|
✓ |
✓ |
Single or superimposed views |
Data processing#
Signal |
Image |
Feature |
|---|---|---|
✓ |
✓ |
Process isolation for running computations |
✓ |
✓ |
Remote control from Jupyter, Spyder or any IDE |
✓ |
✓ |
Remote control from a third-party application |
✓ |
✓ |
Sum, average, difference, product… |
✓ |
✓ |
Operations with a constant |
✓ |
✓ |
Logarithm, exponential… |
✓ |
Square root, power |
|
✓ |
✓ |
Average, standard deviation |
✓ |
Derivative, integral |
|
✓ |
✓ |
ROI extraction, Swap X/Y axes |
✓ |
Semi-automatic multi-peak detection |
|
✓ |
✓ |
Convolution, deconvolution |
✓ |
Flat-field correction |
|
✓ |
Flip, rotation, scaling… |
|
✓ |
Intensity profiles (line, average, radial) |
|
✓ |
Horizontal and vertical projections |
|
✓ |
Pixel binning |
|
✓ |
Linear calibration |
|
✓ |
Polynomial calibration |
|
✓ |
✓ |
Normalization, Clipping, Offset correction |
✓ |
Reverse X-axis |
|
✓ |
Replace X by other signal’s Y (calibration) |
|
✓ |
X-Y mode |
|
✓ |
Thresholding (manual, Otsu…) |
|
✓ |
✓ |
Gaussian filter, Wiener filter |
✓ |
✓ |
Moving average, moving median |
✓ |
✓ |
FFT, inverse FFT, Power/Phase/Magnitude spectrum, Power Spectral Density |
✓ |
Interpolation |
|
✓ |
✓ |
Resampling |
✓ |
Detrending |
|
✓ |
Interactive fit: Gauss, Lorentz, Voigt, polynomial, CDF… |
|
✓ |
Interactive multigaussian fit |
|
✓ |
Frequency filters (low-pass, high-pass, band-pass, band-stop) |
|
✓ |
Windowing (Hann, Hamming…) |
|
✓ |
Stability analysis (Allan variance, Hadamard variance…) |
|
✓ |
Butterworth filter |
|
✓ |
Exposure correction (gamma, log…) |
|
✓ |
Restoration (Total Variation, Bilateral…) |
|
✓ |
Morphology (erosion, dilation…) |
|
✓ |
Edge detection (Roberts, Sobel…) |
|
✓ |
✓ |
Analysis on custom ROI |
✓ |
FWHM, FW @ 1/e² |
|
✓ |
Pulse features extraction |
|
✓ |
Dynamic parameters (ENOB, SNR…), Sampling period/Rate |
|
✓ |
Centroid (robust method w/r noise) |
|
✓ |
Minimum enclosing circle center |
|
✓ |
2D peak detection |
|
✓ |
Contour detection |
|
✓ |
Circle Hough transform |
|
✓ |
Blob detection (OpenCV, Laplacian of Gaussian…) |
Workspace and traceability#
HDF5 workspaces, and an HDF5 browser to import data sets from any HDF5 or NeXus file (see HDF5 Browser)
History panel to record, replay (silently or step by step) and duplicate processing chains (see History Panel)
Provenance of results: how each result was obtained, checked against the data and verified by recomputation (see Provenance of results)
Workspace capsules (
.dlcapsule) to exchange a workspace with the provenance of its processing (see Workspace capsules)Welcome page, Applications panel and command palette (see Overview)
Optional AI assistant (see AI Assistant)
Extensibility#
Plugins adding processing features, file formats or complete applications, reloaded without restarting DataLab (see Plugins)
DataLab plugin catalog: official and community plugins, installed in one click from DataLab
Plugin generator: a working plugin in a single Python file, ready to publish in the catalog (see From an idea to the plugin catalog)
Macro-commands, remote control and Web API to automate DataLab from Python, Jupyter notebooks or any application