

DataLab for spectroscopy#
The problem#
Spectra coming out of an instrument – Raman, FTIR, XRF, or any energy/wavelength scan – rarely come clean: noise, baseline drift, overlapping peaks. The usual options are vendor software (closed, one instrument), spreadsheets (error-prone, no traceability), or custom scripts (weeks of work, hard to share with non-programmers).
What DataLab does#
DataLab lets you chain the whole analysis interactively, and keeps every processing step recorded with its parameters:
filter noise (Wiener, moving average, and more),
correct the baseline, including linear detrending restricted to peak-free regions – a robust approach when peaks dominate the signal,
select a region of interest and fit a model (Gaussian, Lorentzian, Voigt, multi-peak…),
save the whole workspace (data + processing history + metadata) to a single HDF5 file that colleagues can reopen – in the desktop app or in the browser.
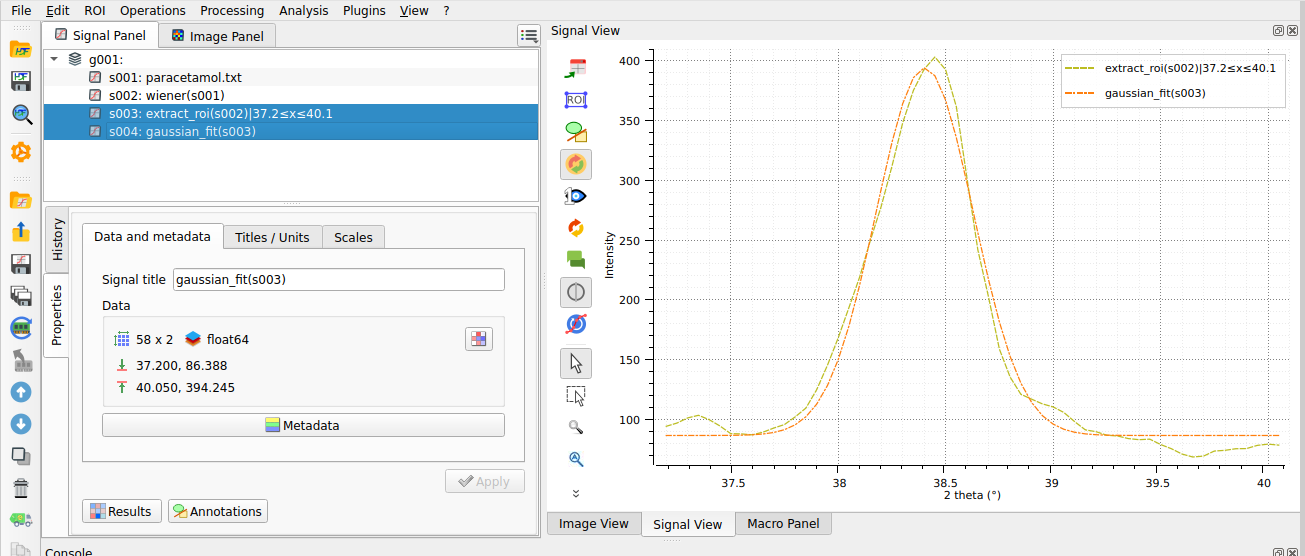
A Gaussian fit on a region of interest of a spectrum in DataLab.#
Every operation is also available from Python (scripts, Jupyter, macros), so an interactive analysis can be turned into an automated pipeline processing a whole series of spectra.
Proof in production#
DataLab was built for and is used in production at CEA’s Laser Megajoule facility, where spectrometer data are processed and visualized as part of the plasma diagnostics workflows.
Try it#
No install: open DataLab-Web with a demo spectrum already loaded in your browser – your data never leaves your machine.
Step-by-step tutorial: Spectrum analysis: denoising, baseline correction and peak fitting.